top of page

Academic Test Writing Task 1

  WRITING  

In task 1 of the IELTS Academic Test, you will be asked to describe a chart, table, map, diagram or process. You need to write a minimum of 150 words and should use formal academic language as much as possible. For more information on this task go to Writing Task 1 (Academic Test), and for model answers to the tasks, with useful language, click on the links below.

IELTS Writing 3.jpg

Academic Writing Task 1 Questions with Model Answers:

1. Diagram

The diagram below shows the stages and equipment involved in producing electricity from wind.


Summarise the information by selecting and reporting the main features.

2. Table

The table below shows the percentage changes in consumer spending in four European countries over a 3 year period.


Summarise the information by selecting and reporting the main features and make comparisons where relevant.

3. Pie chart

The pie charts below show the number of people employed in several job types in the United Kingdom in 1991 and 2001.


Summarise the information by selecting and reporting the main features, and making comparisons where relevant.

4. Bar Chart

The graph below shows the average number of tickets sold in a theme park from Monday to Sunday during three periods of the day.


Summarise the information by selecting and reporting the main features, and making comparisons where relevant.

5. Line Graph

The graph below shows the consumption of orange juice and some other types of juice in a European country between 1990 and 2010.


Summarise the information by selecting and reporting the main features, and making comparisons where relevant.

6. Pie Chart

The pie charts below show the proportions of people using various internet browsers around the world in January 2010 and January 2020.


Summarise the information by selecting and reporting the main features, and making comparisons where relevant.

7. Table

The table below shows the percentages of household expenditure for four areas of consumption in various European countries.


Summarise the information by selecting and reporting the main features, and making comparisons where relevant.

8. Map

The diagrams below show the changes that have occurred around a school between 1990 and 2010.


Summarise the information by selecting and reporting the main features and make comparisons where relevant.

9. Diagram

The diagram below shows the process and equipment involved in producing electricity with a nuclear reactor.


Summarise the information by selecting and reporting the main features.

10. Line Graph

The line graph below shows the usage of different internet browsers between 2007 and 2019.


Summarise the information by selecting and reporting the main features, and making comparisons where relevant.

11. Bar Chart

The chart below shows the number of automobiles that several countries imported and exported in 2011.


Summarise the information by selecting and reporting the main features and making comparisons where relevant.

12. Bar Chart

The chart below shows the percentages of people in various age groups in the UK who are obese, overweight, normal or underweight.


Summarise the information by selecting and reporting the main features and making comparisons where relevant.

13. Pie Charts

The pie charts below show the percentages of different fuels used to produce energy in the United States in 2011 and then in 2040.


Summarise the information by selecting and reporting the main features and making comparisons where relevant.

14. Diagram

The diagram below shows the processes involved in the water cycle.


Summarise the information by selecting and reporting the main features.

15. Table

The table below shows the amount of coal produced in four countries in 2007, 2014 and, 2020.


Summarise the information by selecting and reporting the main features and make comparisons where relevant.

16. Bar Chart

The chart below shows the annual sales of plug-in electric vehicles in the top selling markets between 2011 and 2021.


Summarise the information by selecting and reporting the main features and make comparisons where relevant.

17. Map

The map below shows the changes that occurred on a tropical island between 2006 and 2021.


Summarise the information by selecting and reporting the main features and make comparisons where relevant.

18.  Line Graph

The line chart below shows world grain (cereal) production from 1960 through 2011 measured in million hectares planted and million tons harvested.


Summarise the information by selecting and reporting the main features and make comparisons where relevant.

19. Pie Chart

The pie charts below show the percentage of time spent accessing the internet by device type in the UK in 2015 and 2020.


Summarise the information by selecting and reporting the main features and make comparisons where relevant.

20. Bar Chart

The bar chart below shows the percentage of people who used a computer daily in the UK in 2006 and 2012.


Summarise the information by selecting and reporting the main features and make comparisons where relevant.

21. Diagram

The diagram below shows the manufacturing process for making apple juice from apples.


Summarise the information by selecting and reporting the main features and make comparisons where relevant.

22. Line Chart

The line chart below shows the changes in GDP of three countries between 1991 and 2021.


Summarise the information by selecting and reporting the main features and make comparisons where relevant.

23. Table

The table below shows the percentage of male and female smokers in four countries in 1978, 1998 and 2018.


Summarise the information by selecting and reporting the main features and make comparisons where relevant.

24. Bar Chart

The chart below shows the percentage change in house prices in five cities between 2000 and 2020 compared with 1999.


Summarise the information by selecting and reporting the main features and make comparisons where relevant.

25. Pie Chart & Table

The pie chart below shows the main causes of CO2 emissions. The table shows the causes of CO2 emissions in three regions.


Summarise the information by selecting and reporting the main features and make comparisons where relevant.

26. Diagram

The diagram below shows how the weather office collects information on the weather in order to produce weather forecasts.


Summarise the information by selecting and reporting the main features and make comparisons where relevant.

27. Line Chart

The chart below shows the percentages of unemployed people in three European countries from 1991 to 2021.


Summarise the information by selecting and reporting the main features and make comparisons where relevant.

28. Bar Chart

The bar chart below shows the total population of four regions in 2005, 2020 and a forecast for 2035 and 2050.


Summarise the information by selecting and reporting the main features and make comparisons where relevant.

29. Pie Charts

The pie charts below show the percentage of shipments made by various transportation modes in 1990, 2020, and forecasted for 2050.


Summarise the information by selecting and reporting the main features and make comparisons where relevant.

All questions were created for fastforwardielts.com and are not real IELTS test questions. They aim to follow the same style as IELTS and can be used for practice when preparing for the test.

Test Tips Writing.png
Read the task rubric (information) carefully

The task rubric gives you a lot of information about what the chart shows. Pay attention to key words in the rubric so that you talk about the data in the right way. Check if the chart shows percentages or numbers. Also double check if the chart shows changes rather than totals.

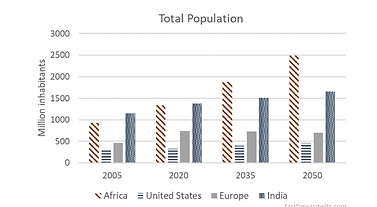
Look at the chart labels carefully

The chart labels, including along the bottom and side of the chart, may give you important information about the data in the chart. For example, they may say which regions, or time periods the data covers, or whether the chart shows percentages or numbers.


Give an overview in your introduction

Don’t forget to give an overview of the main trends or features of the data in your introduction. You can begin your overview with, “Overall, the chart shows…”


Divide the data into logical paragraphs

After your introduction, you should aim to have two body paragraphs. Look for a logical way to separate the data into these two body paragraphs. You can usually divide the chart into two time periods, however you may also be able to group lines on the chart by their respective trends. For example, paragraph 1 (2001 - 2010) & paragraph 2 (2011 - 2020) or paragraph 1 (lines 1 and 4) & paragraph 2 (lines 2 and 3).


Percentages or numbers?

If the chart shows percentages you must talk about percentages or proportions, not numbers or amounts. Remember that a small percentage of a large group can actually be a bigger number than a large percentage of a small group.


Compare and contrast the data

Don’t just describe the trend in one line, compare and contrast it with the trend in another line or lines. Look for differences and similarities between different lines on the chart, or between different time periods. Use adverbs and phrases such as while/ whereas/ however/ on the other hand. For example, “Between 2001 and 2007 the production of gold increased substantially, whereas from 2008 to 2012 it fell slightly”/ “The chart clearly shows an increase over time in the consumption of chicken, while the consumption of beef remains constant.”

Refer to specific data points

Don’t just say, “the number of unemployed people increased”. Say, “the number of unemployed people increased from around 5% to 10% between 2008 and 2010”.


Use the appropriate tenses

Past Perfect: Describe changes in the data which happened before a time in the past

Past simple: Describe data in the past

Present perfect: Only use if the data shown continues up to the present year

Future (Will): Describe predictions for future data

Future Perfect: Describe changes in the data which will have happened before a time in the future

Use the past perfect tense

You can use the past perfect tense + by + time to show that something had happened before a particular point in time. For example, “the percentage of obese adults had increased from 10% to 20% by 2010,”.

Use the future perfect

If the chart shows data for a future time + by + time, you can use the future perfect to show that a change will have happened by this time. For example, “the percentage of people living in cities will have reached 70% by 2040.

Practise your prepositions

Prepositions are always difficult but fortunately you don’t need to know many to describe charts. The key prepositions you need are for time periods (e.g. from 2001 to 2005)/ between 2001 and 2005), for noun + noun (an increase in something), for amounts (consumption increased by 20%) or ranges (e.g. consumption increased from 20 million litres to 25 million litres).


Change between nouns/ verbs and passive/ active voice

If the chart shows the consumption of different types of food, you don’t have to repeat “consumption” all the time. You can also use the verb “consume”. You may also switch between the passive and active voice, saying, “people consumed” or “fruit was consumed”. 


Don’t give personal opinions or make personal predictions

You shouldn’t give your opinion about what is good or bad in the data. Only describe it. For example, if the chart shows a large increase in the consumption of fruit between 2001 and 2005, you should say, “between 2001 and 2005 there was a significant rise in the consumption of fruit”. You should not add, “This was great for people’s health as eating fruit is part of a healthy diet”.

Comments
Couldn’t Load Comments
It looks like there was a technical problem. Try reconnecting or refreshing the page.
bottom of page